ACC revenue distribution and tv viewership
Who will get more and who will get less?

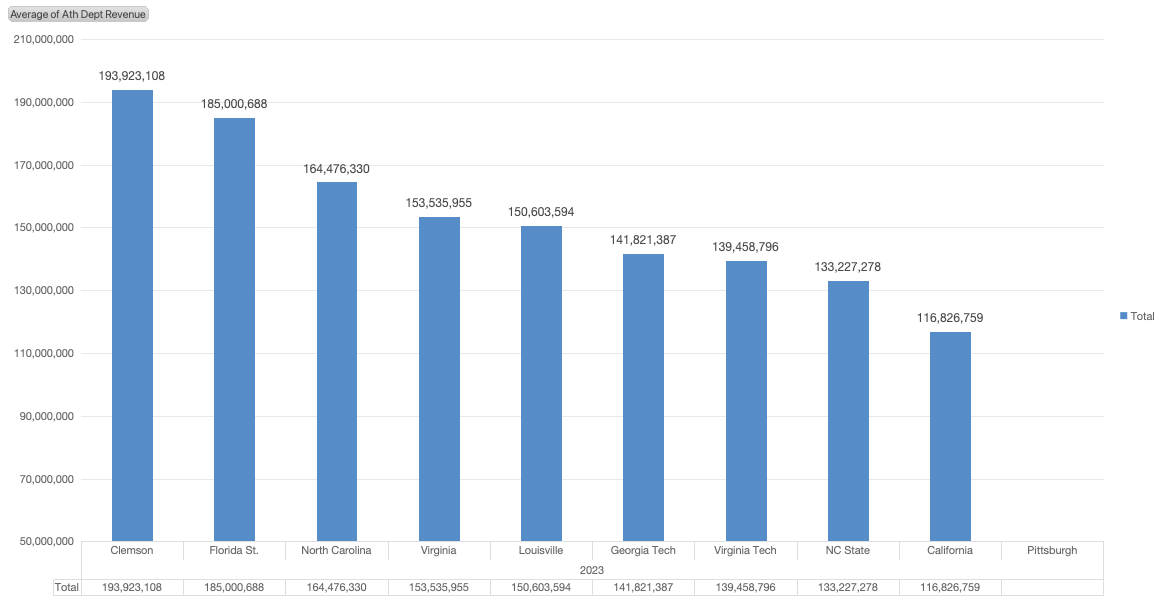
The ACC has almost completed their second year under the new revenue distribution model put in place at the start of the 2024-2025 academic year (2024 football season). As of this writing on April 1, 2026 we do not yet know the impact from that first year on the revenue for individual ACC schools. What we do know is the overall Athletic Department revenue for the ACC public schools for the 2023-2024 year.
For the new ACC revenue model, we have enough information from reporting to get a good sense of how the new model works. There are two key aspects as reported by Brian Murphy at WRAL News:
The Success Initiative: Each year, schools will be paid extra money based on the post season accomplishments of their football, men’s basketball, and women’s basketball teams.
“Football teams earned $4 million for an appearance in the new 12-team College Football Playoff with the chance to earn more by advancing through the playoff – $4 million for the second round, $6 million for the semifinals, $6 million for the title game.”
“Football teams that reached a bowl game…would receive $1.8 million, teams that finished in the AP Top 25 would receive another $1.8 million.”
“For each game played in the NCAA basketball tournament teams would receive approximately $350,000 (men) or $60,000 (women).”
The Viewership Distribution of Media Money: 40% is guaranteed to be shared equally among all eligible ACC schools (excludes ND for football, Stanford and Cal get partial, SMU must wait 12 years). 60% is now dependent on tv viewership that is a rolling 5 year average. This variable number is based on 75% football viewership and 25% basketball viewership.
What we don’t know is what games are counted for the tv viewership calculations. So I am going to provide four different scenarios to show who will be the winners and losers within this new model. Exclude Stanford, Cal, and SMU because they are not eligible for the viewership based money at this time.
All viewership numbers are in thousands. So a 1,500 number is equal to 1.5 million viewers.
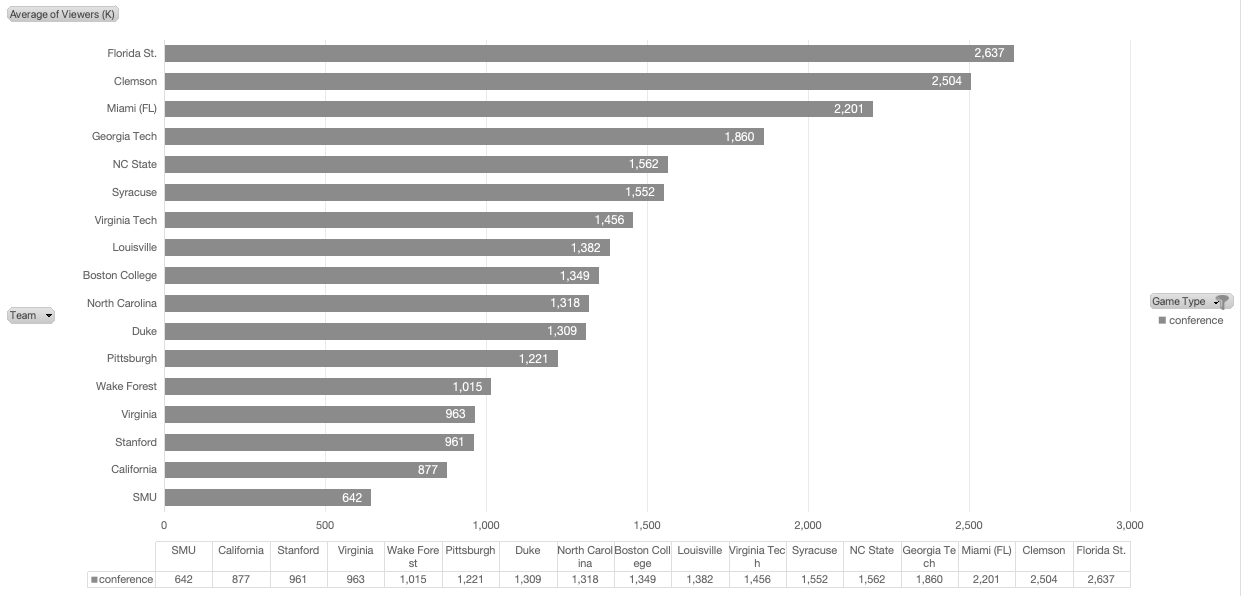
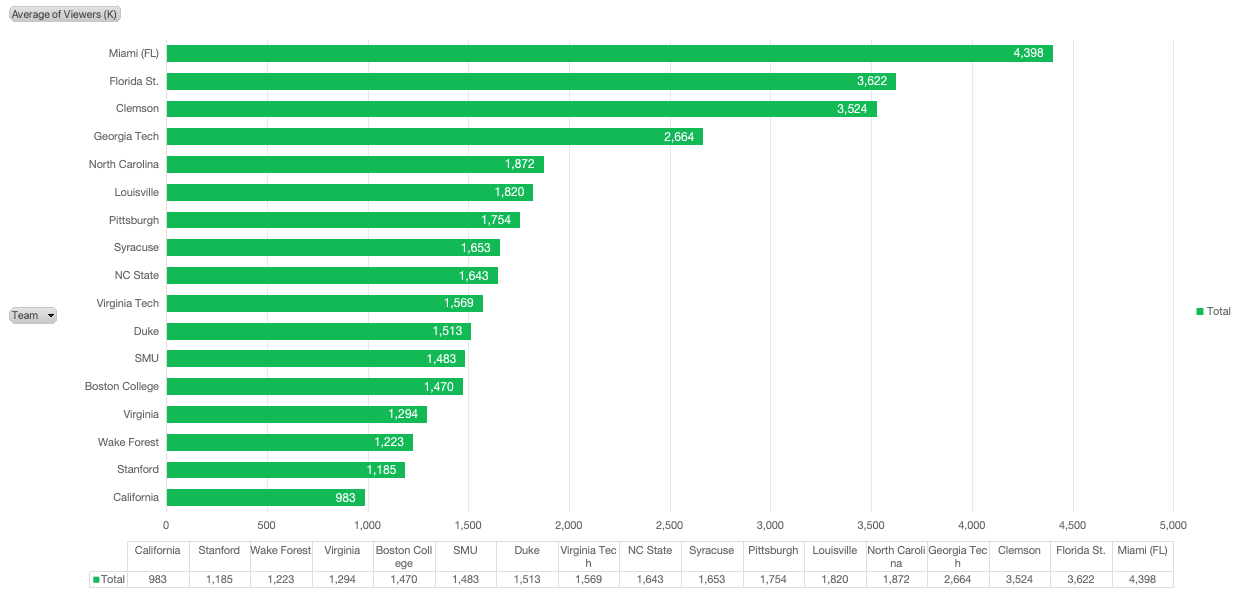
Scenario 1: Only ACC regular season conference games
Top four teams are FSU, Clemson, Miami, Georgia Tech.
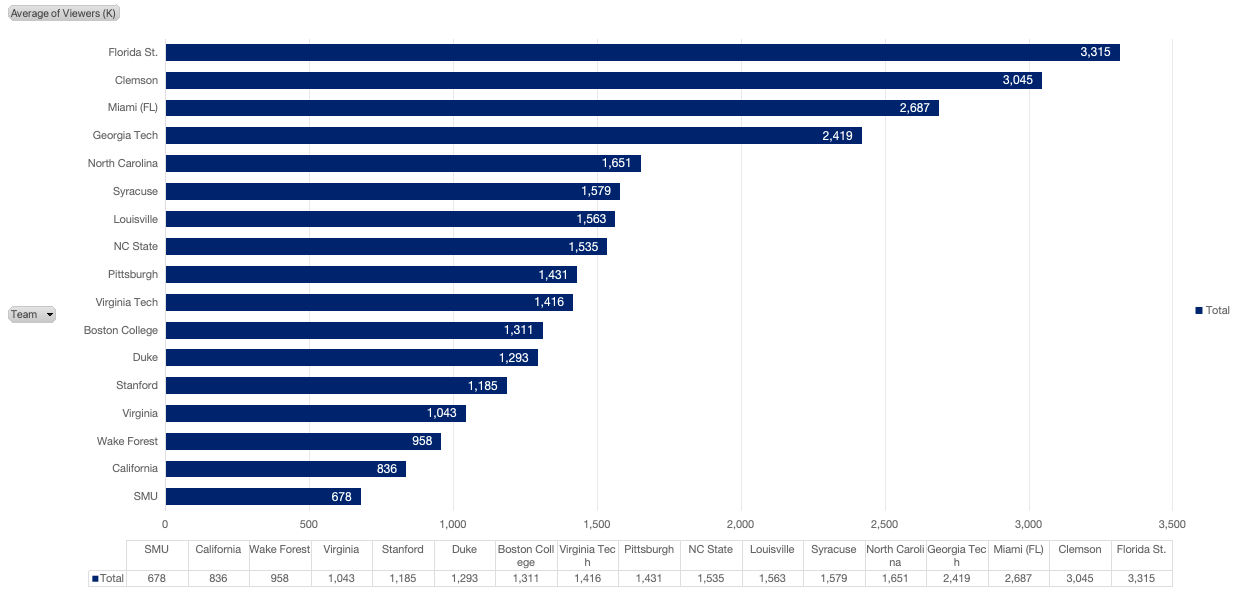
Scenario 2: All ACC regular season games (conference + OOC)
Top four teams are FSU, Clemson, Miami, Georgia Tech.
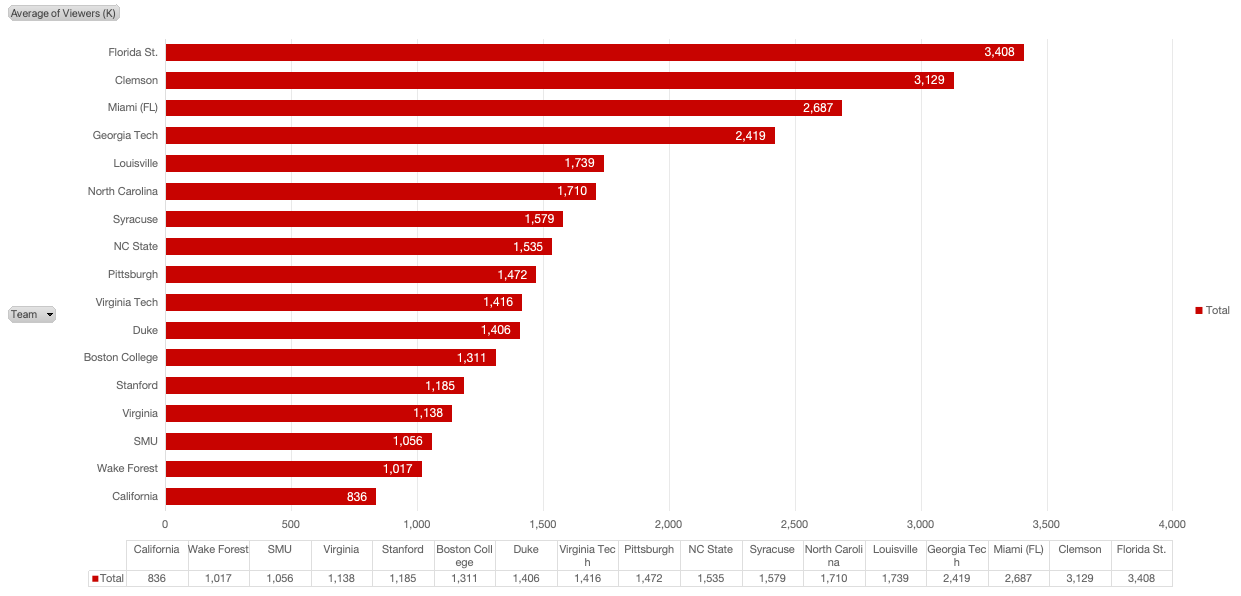
Scenario 3: All ACC regular season games (conference + OOC) and ACC conference championship games
Top four teams are FSU, Clemson, Miami, Georgia Tech.
Scenario 4: All ACC regular season games (conference + OOC) and ACC conference championship games and post-season games (bowls and playoffs)
Top four teams are Miami, FSU, Clemson, Georgia Tech (the playoff viewership boosted Miami to the top).
You can see how each of the scenarios added to the total with this summary chart. This is in the same order as the scenario 1 chart.
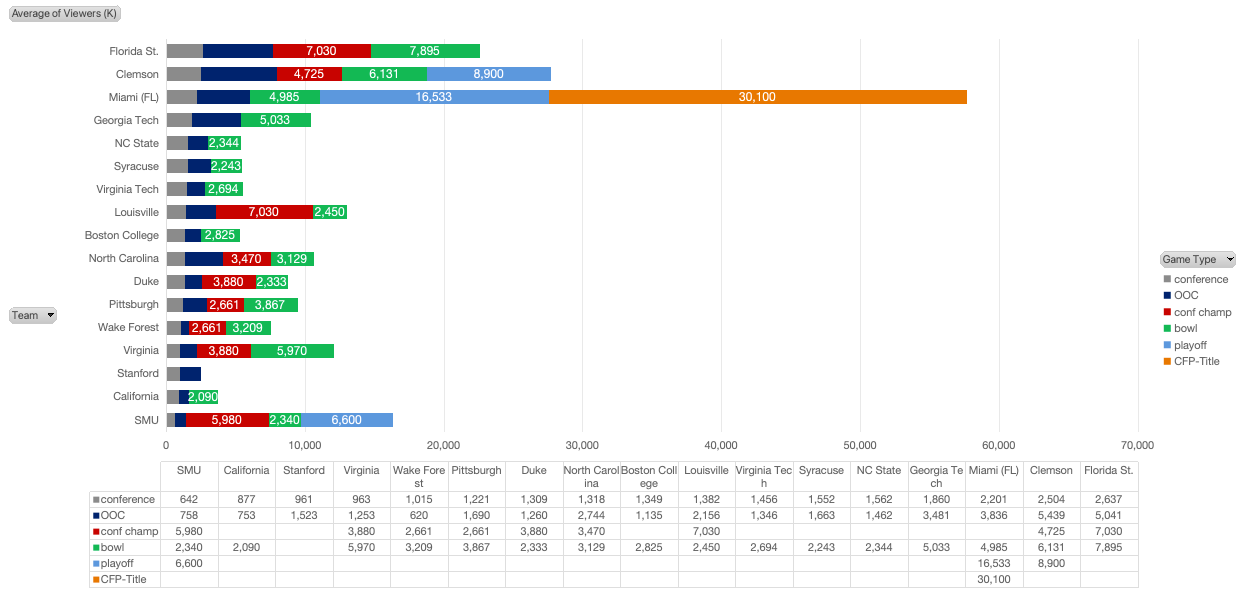
A run in the playoffs can significantly boost the standings of a team. But on average, the teams at the top are set. The big winners of the new ACC model will be FSU, Clemson, Miami, and Georgia Tech. With FSU and Clemson already making $20+ million more annually in revenue compared to the rest of the conference, the wealth gap will continue to grow and make it harder for the other schools to keep up.