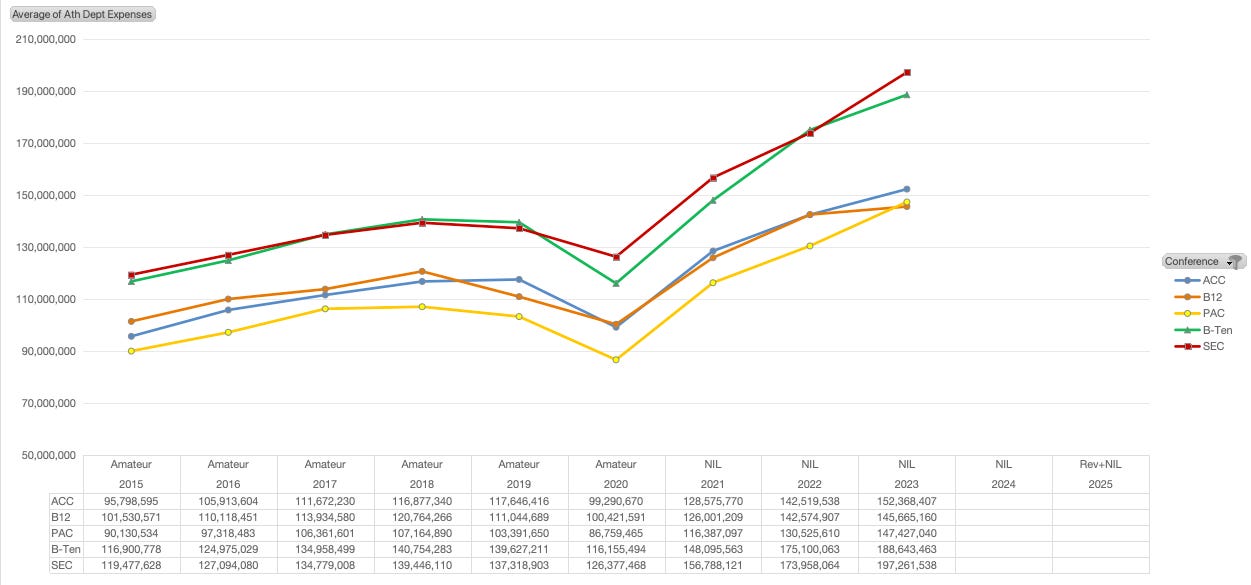
The money chart
Yes, the money matters

When comparing conferences, especially across years, we need something more than just wins and losses. We need something to help us understand why some thrive while others fall behind. And the best data for that is to show you the money.
Every year in the spring, public schools disclose their revenue and expenses for the previous school year (approximately July to June). These numbers include overall and detailed athletic department financials.
Note: This is only for public universities because private schools do not have the same legal reporting requirements.
As an example, for the 2015-2016 year (and football season), the athletic department revenue and expense would be publicly shared in the spring of 2017 after taxes have been filed.
The data provided below is a summary view across conferences. Specifically, it is showing an average of overall athletic department spending across all the public schools within each conference.