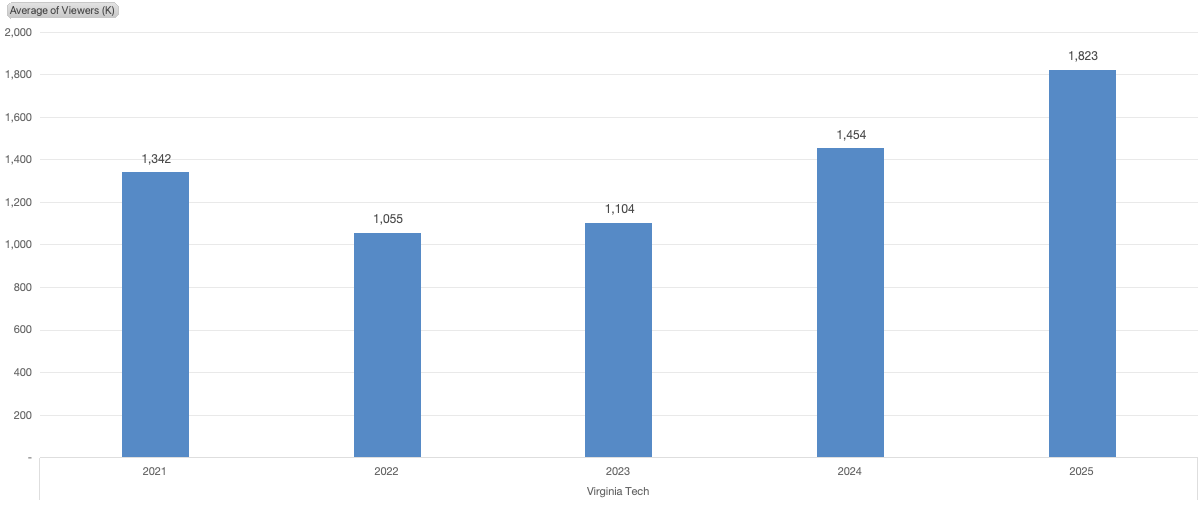
Virginia Tech average tv viewership
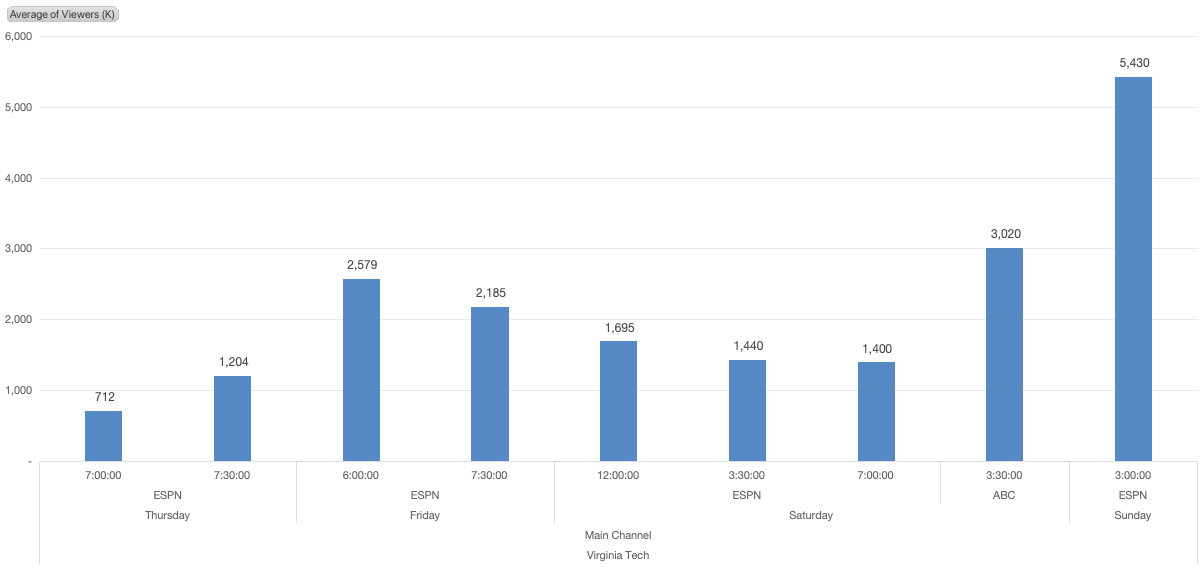
Data by channel, day, and time for past 5 years

If you have ever wondered how the viewership for VT games changes based on the day of the game, the time of the game, or the channel it was on?
Below are several charts providing a summary of that data over the past five seasons (2021-2025). All data shown is in thousands (e.g., 5,430 = 5.4 million viewers). In order to provide a fair comparison of VT against other schools, all data shown is just for regular season games.
First we will look at the average viewership data for when VT is on the main channels (ESPN, ABC, CBS, NBC, FOX).
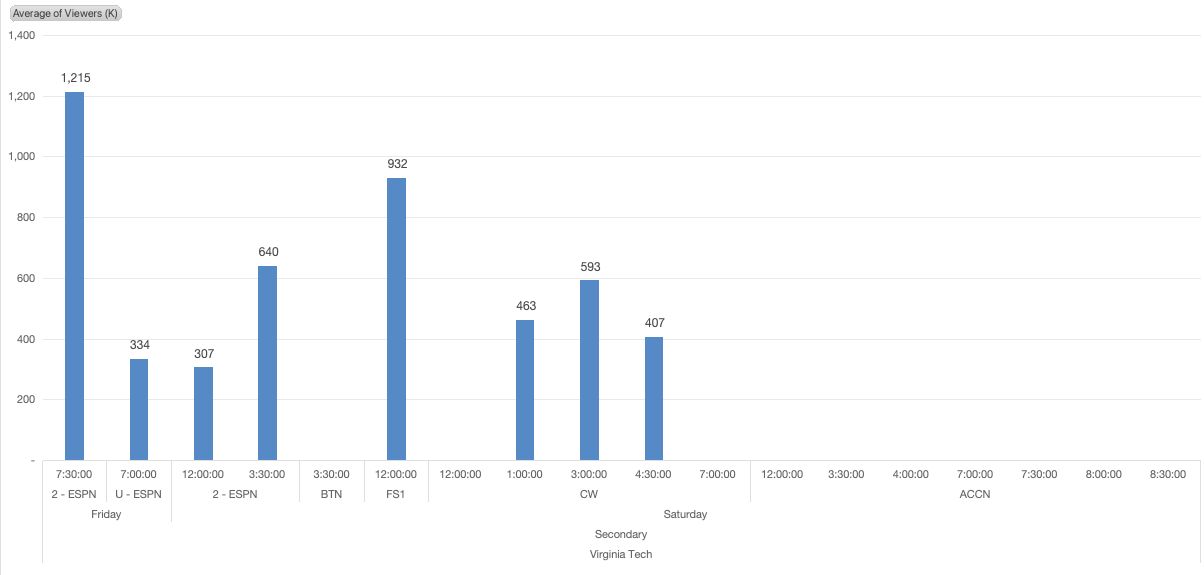
Here is the average viewership data for the secondary channels. Note, you will see a lot of blanks because the publicly available data does not provide numbers for every single game. Sometimes this is because the numbers are very low and not reported. More often it is just certain channels (e.g., ACCN, BTN, SECN) that do not report numbers at all.
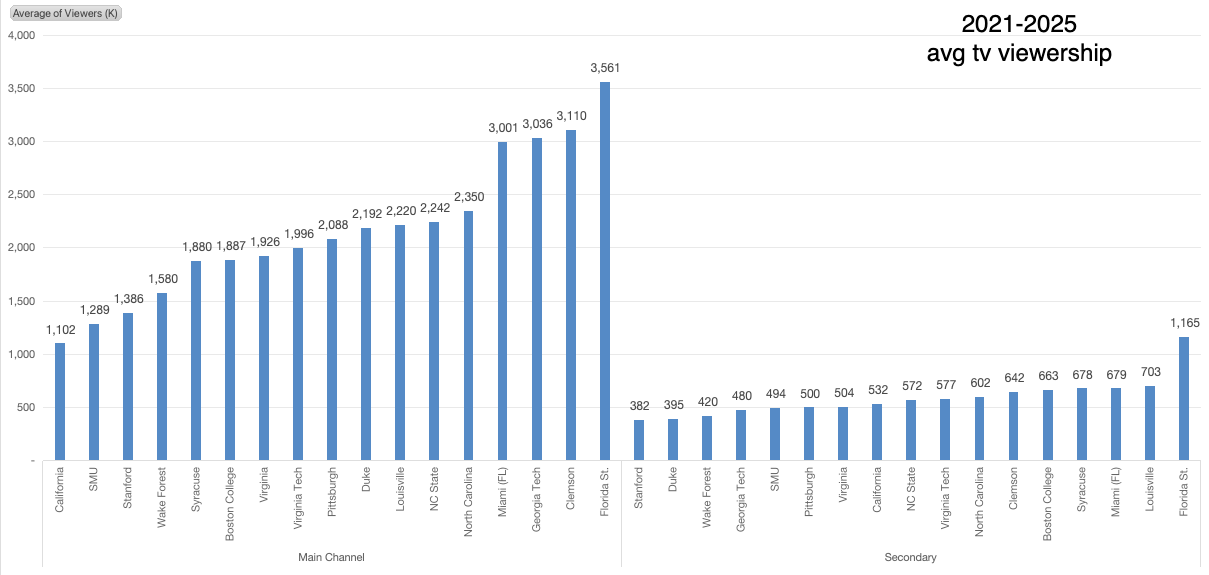
But how does VT compare against the rest of the ACC over the past five years? I’ll first show the summary data separated by main channel vs secondary channel. And then I will show the overall combined summary for each school to do a total comparison
.
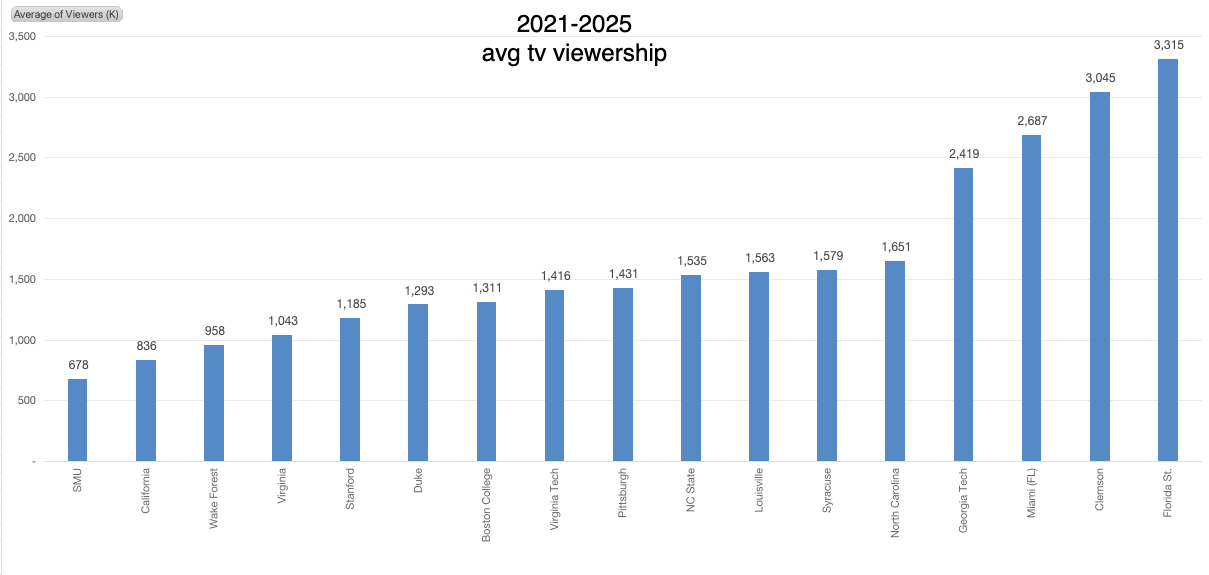
The overall trend for VT has been going up over the past few years, but still needs to make a big jump in order to be among the top tv viewership brands in the ACC. The goal should be to average at least another 1 million viewers per game each season. As a point of reference, the top brands in the country average between 4 million and 7 million viewers per regular season game. And that is where they provide the media value.